Grey Line Propagation
| COMMS Working Group |
| Hawaii |
Alaska |
Pacific |
Mountain |
Central |
Eastern |
Puerto Rico |
UTC |
Guam |
All data depicted on this page resides on external web pages. This page pulls multiple resources together onto a single page. This page will self-refresh every 15 minutes. Clicking on a graph, map or chart will open the web page with the original source data. The NVIS World Map data from Australia is updated hourly while the foF2 Critical Frequency Plot from Austin is updated every 15 minutes.
For a point to point propagation prediction that depicts probabilities for each band and allows for determining the best frequency and best time to make a long distance HF contact, please see VOACAP Online.
The quick guide for VOACAP Online can be found here.
The manual for VOACAP Online can be found here.
To create a coverage prediction map for any given band, use VOACAP based coverage prediction.
Please note that VOACAP may not produce an accurate prediction for NVIS or ground-wave propagation modes.
If you do not know how to use the data depicted on this page, please view the HF NVIS Frequency Band Selection article that can be found under the Resources menu, or by clicking here.
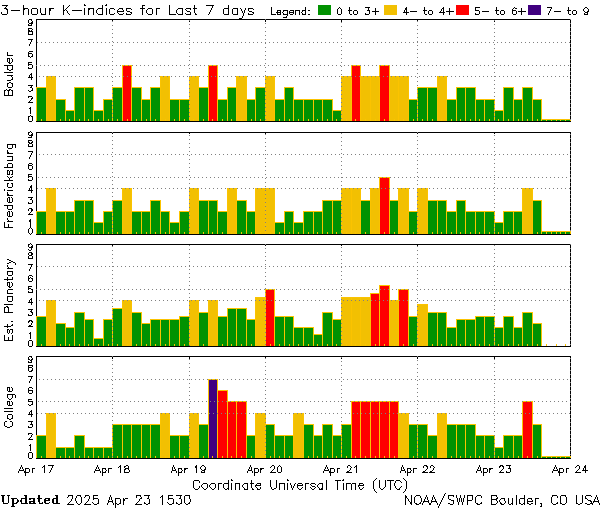
| Solar Weather A & K Indices | ||||
|---|---|---|---|---|
| A | K | Description | ||
| 0 | 0 | Quiet | ||
| 2 | 1 | Quiet | ||
| 3 | 1 | Quiet | ||
| 4 | 1 | Quiet to unsettled | ||
| 7 | 2 | Unsettled | ||
| 15 | 3 | Active | ||
| 27 | 4 | Active | ||
| 48 | 5 | Minor storm | ||
| 80 | 6 | Major storm | ||
| 132 | 7 | Severe storm | ||
| 208 | 8 | Very major storm | ||
| 400 | 9 | Very major storm | ||
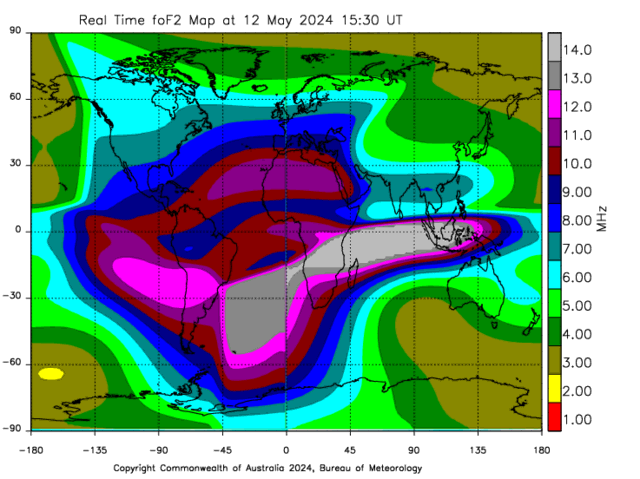
Where the above map indicates the foF2 NVIS Critical Frequency, the relationship between the foF2 frequency and the Maximum Usable Frequency (MUF) is approximately 1:3. Multiplying the foF2 critical frequency by 3 approximates the MUF. The following color chart is adjusted to indicate the MUF.

Note that the critical frequency (CF), which is appropriate for good NVIS communications, is approximately 1/3 of the maximum usable frequency (MUF). The critical frequency (CF) is indicated at the foF2 entry at the top left of the Austin digisonde image immediately above.
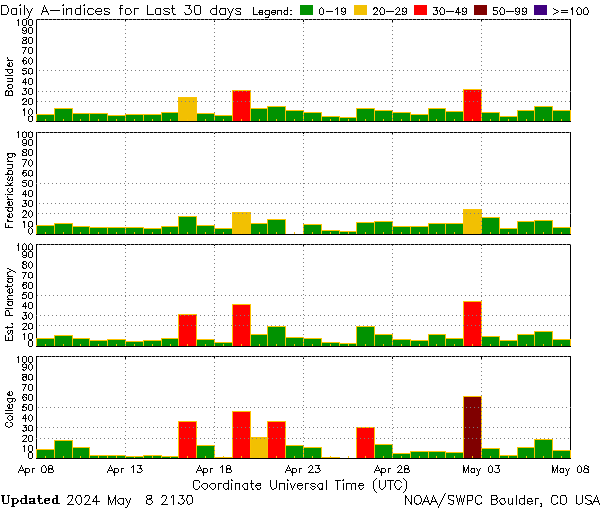
| Solar Weather A & K Indices | ||||
|---|---|---|---|---|
| A | K | Description | ||
| 0 | 0 | Quiet | ||
| 2 | 1 | Quiet | ||
| 3 | 1 | Quiet | ||
| 4 | 1 | Quiet to unsettled | ||
| 7 | 2 | Unsettled | ||
| 15 | 3 | Active | ||
| 27 | 4 | Active | ||
| 48 | 5 | Minor storm | ||
| 80 | 6 | Major storm | ||
| 132 | 7 | Severe storm | ||
| 208 | 8 | Very major storm | ||
| 400 | 9 | Very major storm | ||
Page loaded Sat, 27 Apr 2024 0808 UTC, will reload Sat, 27 Apr 2024 0823 UTC.